
Written by Laura Rodriguez Takeuchi, Research Officer at Overseas Development Institute.
In a recent speech at the Bond conference, a meeting of UK organizations working in international development, the UK secretary of state, Justine Greening, seems to suggest that we need not be concerned with pro-poor growth. In her view, poverty will fall as a rather automatic consequence of economic development. Throwing some numbers in to support the argument she says “We know wherever long-term per capita growth is higher than 3%, poverty falls significantly”. Is that really the case?
Of course, rapid economic growth should lead to poverty reduction. China’s fast growth has helped lift close to 700 million people out of poverty. But, when looking at how different groups of people have shared in growth, it is clear that average growth does not automatically translate into equal growth in consumption for the poorest people. Even in China, poverty reduction would have been even more impressive had growth been better distributed. For this to be achieved, growth not only needs to reach the poor, but also, it needs to be faster for those in the very bottom of the society, in other words, it needs to be pro-poorest (PP2G). Why look at pro-poorest growth – higher growth in consumption for the bottom 5th, 10th or 20th percent of the distribution - as well as pro-poor growth (where growth in consumption of the poor exceeds that of the non-poor)? ‘The poor’ is a heterogeneous category, and while those nearest the poverty line may experience growth, those furthest may not, or vice versa.
By looking at the numbers in more detail, we can see that countries’ experiences with growth and poverty reduction vary greatly. From a sample of countries in South East Asia and East Africa (in the table below), we note that a few cases of pro-poorest growth (PP²G) occur in countries where average growth was indeed over 3%. But not always (or even most of the time). Moreover, some countries achieved PP2G with less than that. Countries achieving pro-poorest growth usually also experienced pro-poor growth, but not always: Malaysia, Mozambique, Tanzania and Thailand experienced one but not the other.

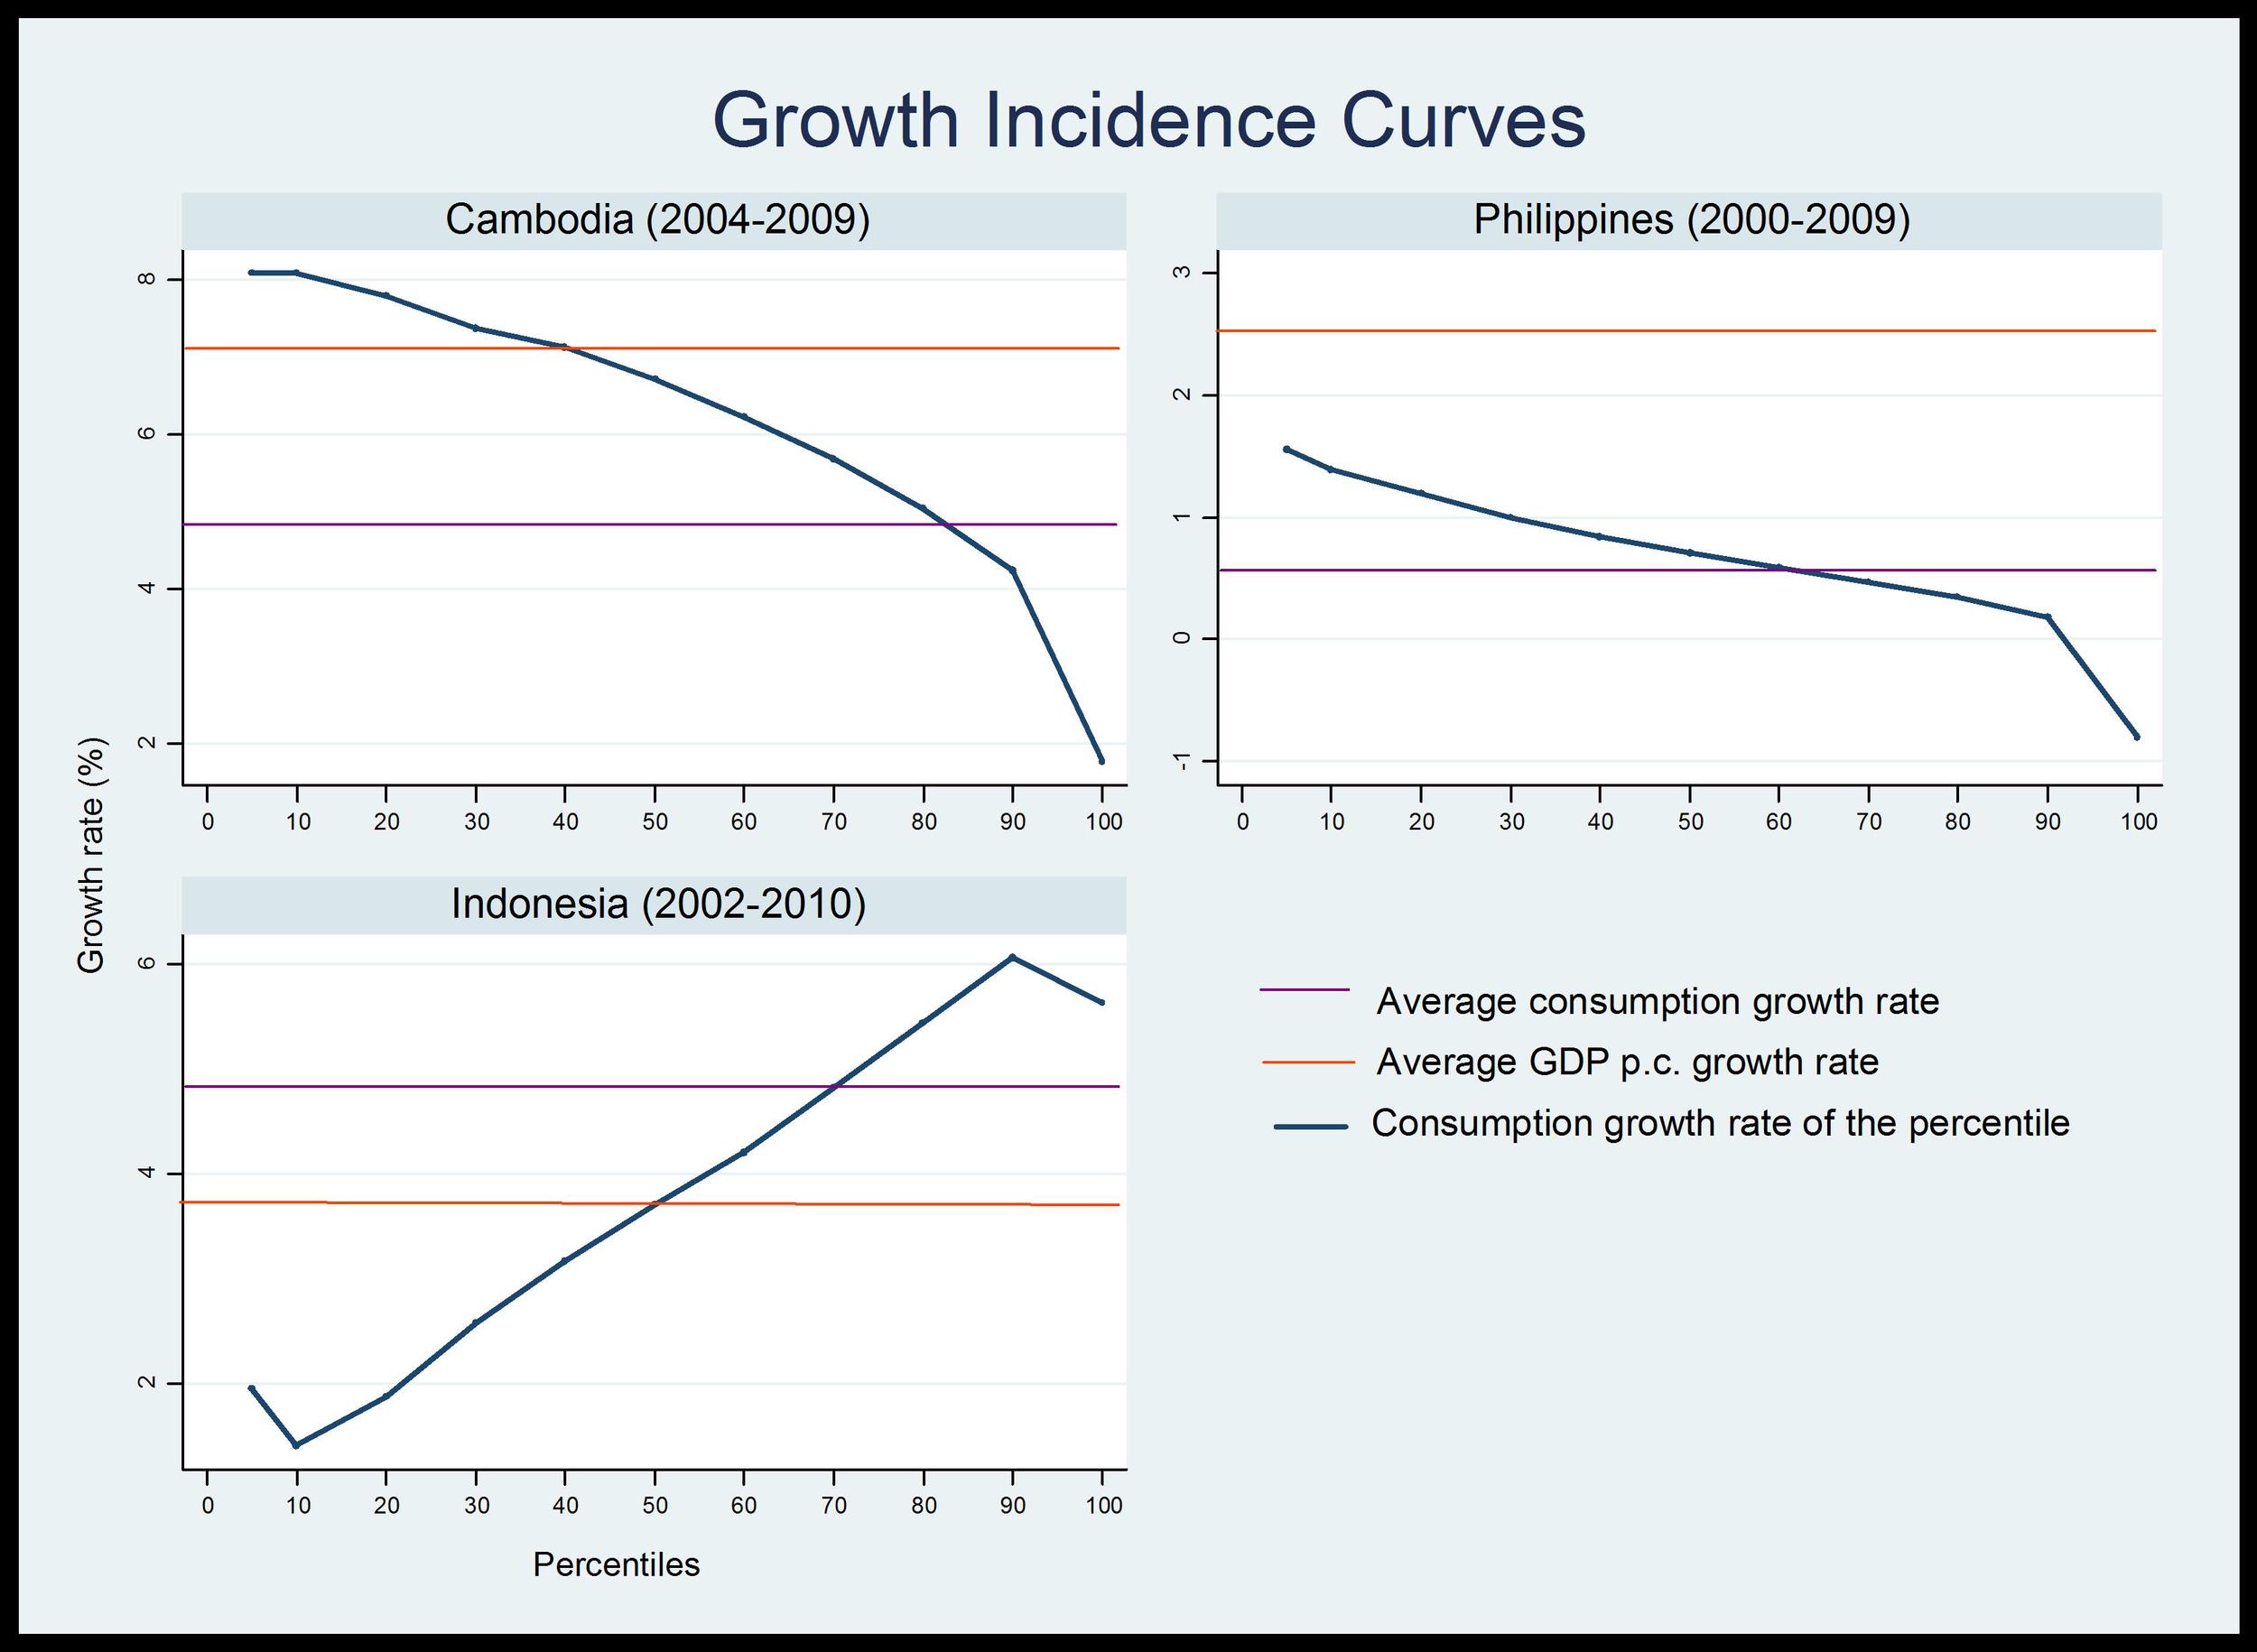
These examples make clear that while growth is important, it can have very different effects on the less fortunate. Take for instance the case of Cambodia. According to our estimates from PovCal data (available here), the average growth rate in consumption between 2004 and 2009 was well above 3% per year. On average, consumption grew nearly 5% per year[1] – and for the bottom 10% of the population, an impressive 8% per year. Poverty fell over this 6 year period from 33% to 13% and the Gini coefficient, which measures inequality in a scale from 0 to 1, fell slightly from 0.36 to 0.35
But this experience is atypical. In Indonesia for instance, the average growth rate between 2002 and 2011 was about the same as that of Cambodia and above Justine Greening’s implied threshold. However, during the same period, consumption for a poor Indonesian in the bottom 20th, 10th or 5th of the distribution only grew below 2% per year, while for those in the upper quintile, growth was much higher (close to 6%). Overall poverty fell (from 29% to 18%), but at a slower pace than in Cambodia. Inequality, on the other hand, increased substantially (the Gini coefficient moved from 0.30 to 0.35). In the Philippines, average consumption growth has been much lower still, – less than 1% per year between 2000 and 2009. At the same time, consumption grew more rapidly for the poorest 10% (1.5% per year) than for the richest (on average 0.2% per year for those above the median). Poverty also fell steadily from 25% in 2000 to 18% in 2009. These findings across the three countries are highlighted in the Growth Incidence Curve graphs below. These show the growth rate for each given part of the distribution, ranked from the poorest -10th percentile- to the richest -90th percentile. It is easy to see radically different patterns consumption growth across the income distribution.
We can only conclude that policies matter for poverty reduction and specially to reach the poorest of all. Our understanding of the determinants of how much the poorest people benefit from growth is still at an early stage. Some have pointed to the role of inequality, patterns of employment and the role of education policies. During the coming months we will be trying to unpack why growth in Burundi, Cambodia, Malawi, Philippines, Rwanda and Thailand appears to be much more pro-poorest than growth elsewhere in East Africa and South East Asia.
CPAN’s ambition is now to produce a Chronic Poverty Report on PP²G.This will be based on the policy guides already published – on agriculture, employment, energy, Middle Income Countries, those currently in preparation on financial inclusion, private sector development, and macro-economic policy, as well as this more analytical work.
To sum up, yes, we do need to think about how to achieve pro-poor growth. Poverty reduction is not an automatic consequence of growth. The shape of the process of development and the policies that accompany and support it are crucial for poverty reduction.
[1] Average GDP per capita growth during the period was much higher (close to 7%), this may be related to differences in the estimates derived from national accounts data and survey data.